Subject: Invitation to Global Sources Consumer Electronics
Dear Sir, We are delighted to extend an invitation to you and your esteemed company to join us at the upcoming Global Sources Consumer Electronics,...


+86 15867381241
Effective PDU sizing for future growth rests on three core principles. First, calculate real power draw from live equipment measurements, not nameplate ratings. Second, cap continuous load at 80% of rated capacity, aligned with NEC Section 210.20(A) guidelines for continuous loads. Third, size each A and B feed to carry the full rack load independently — never combine their ratings as a shared capacity pool.
This guide covers the core formulas, redundancy rules, common pitfalls, and a repeatable planning workflow you can apply before every equipment refresh. Accurate rack power planning starts with measured load data, not manufacturer labels.
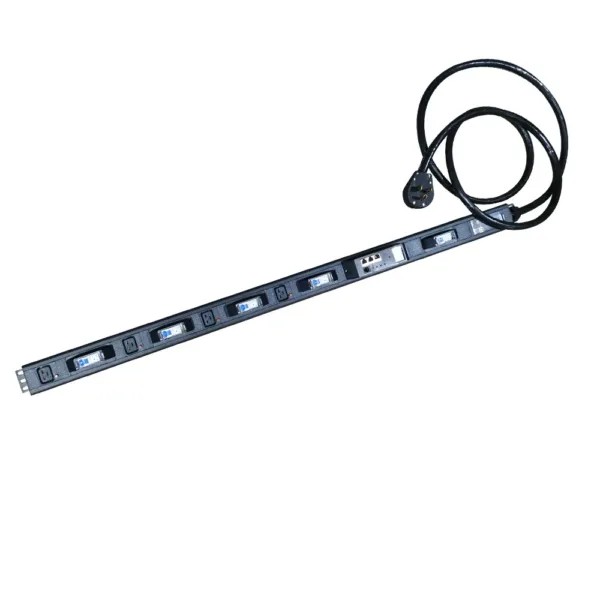
The foundational power formula is straightforward: watts = amps × volts for DC or purely resistive loads. For AC circuits, power factor (PF) adjusts the result to reflect real working power. Fluke defines power factor as the ratio of working power (kW) to apparent power (kVA, or volts × amps). A load with a 0.96 power factor is far more efficient than one at 0.75.
Watts = Volts × Amps × Power FactorWatts = Volts × Amps × 1.732 × Power FactorAlways confirm the phase configuration before calculating. If power factor is unknown, treat the result as a planning estimate, not a guaranteed real power figure. PDU input current ratings describe the maximum current the device and its upstream circuit can carry — they do not directly equal usable server power. For example, a 30A 208V feed with 0.96 PF delivers ~5,990W before continuous-load derating is applied.
Nameplate values are useful for peak and startup sizing, but they almost always overstate typical operating load and understate transient peaks. Servers draw more during boot, high-CPU workloads, and storage activity — idle measurements will underestimate real requirements.
Metered PDUs with inlet metering provide the most accurate baseline for capacity planning. That measured data feeds back into your next planning cycle, and a second pass with projected future load will confirm how much expansion headroom remains after your next hardware refresh.
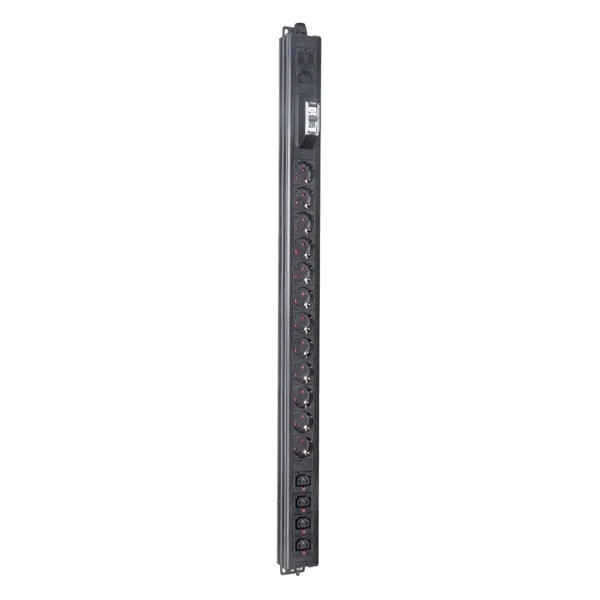
A plan sized only for today’s load will become obsolete within 1–2 years. Standard planning guidelines include three layers of buffer:
| Recommendation | Value | Purpose |
|---|---|---|
| Safety margin | 20% | Absorbs unexpected surges and incremental load additions |
| Continuous load limit | ≤80% of rated capacity | Reduces overload risk and extends equipment life (NEC 210.20(A)) |
| Future expansion headroom | 20–30% above current load | Accommodates 3–5 years of projected growth |
Add your growth allowance to the projected rack load before comparing it to the derated capacity ceiling. The remaining headroom reflects real usable spare capacity, not nameplate totals.
For reference, a 208V 30A three-phase circuit derated to 80% supports roughly 8.6 kW of safe continuous load, per Qu Data Centres.
AI and HPC deployments are rewriting standard rack power assumptions. NVIDIA’s GB200 NVL72 draws ~120 kW per rack, far above the historical 11 kW average. Intelligent rack PDUs once specified for 10–20 kW racks are now regularly deployed in 70–100 kW environments.
For long-range planning:
The most common planning mistake is treating two redundant feeds as a single combined capacity pool. Each feed must carry the entire rack load alone during a failure.
If both feeds run at 70% load in normal operation, a single feed failure will force the surviving path to carry 140% of its rating — tripping the breaker and taking down the full rack. For 2N redundant racks, the standard rule is: no single feed should exceed 50% of its rating during normal operation.
Rack power capacity is always limited by the weakest surviving path, not the sum of both paths. Rack-level totals can also hide per-circuit overloads — always calculate demand bank by bank, starting at the outlet level.
Every feed must be sized to handle the complete projected rack load plus growth margin during a failure event. Add a failover load allowance to your measured baseline before sizing hardware, and verify the final number against the derated feed capacity.
Phase balance is equally critical. An unbalanced rack concentrates current on one leg, making that leg the system bottleneck. Metered PDUs with per-phase monitoring reveal imbalance before it causes failures. Redundancy only works when every phase carries its share of the load.
Revisit your capacity plan every time the equipment list changes, not just when a rack fills up. A quarterly review of measured inlet data keeps estimates aligned with real-world draw. Per-phase readings will catch imbalance before it becomes a failure point.
After every hardware change, re-compare projected load against your derated capacity ceiling to confirm remaining headroom. Rack power assumptions age quickly in high-density environments — a regular review cadence catches drift early.
Measure live load with a metered PDU that supports inlet metering. Nameplate ratings typically overstate base load and understate peak draw. Measured data provides the most realistic foundation for capacity planning.
Per NEC 210.20(A) for continuous loads, keep load at or below 80% of the PDU’s rated current. For reference, a 208V 30A three-phase circuit supports ~8.6 kW of safe continuous load at 80% derating. Always add your growth allowance before checking this ceiling.
Each feed must support the full rack load by itself during a failure. If both feeds run at 70% normally, the surviving feed will see 140% load after an outage, tripping the breaker. For 2N redundancy, cap normal load at 50% per feed.
Include a 20% safety margin for surges and incremental loads, plus 20–30% extra headroom for future expansion. These buffers prevent overloads and extend equipment service life.
Reassess whenever the equipment list changes, and run a full quarterly review using measured metered PDU data. High-density AI and HPC deployments require more frequent updates as density assumptions evolve rapidly.